The Color Index

2007 Cabernet Sauvignon, Kestrel Vineyards
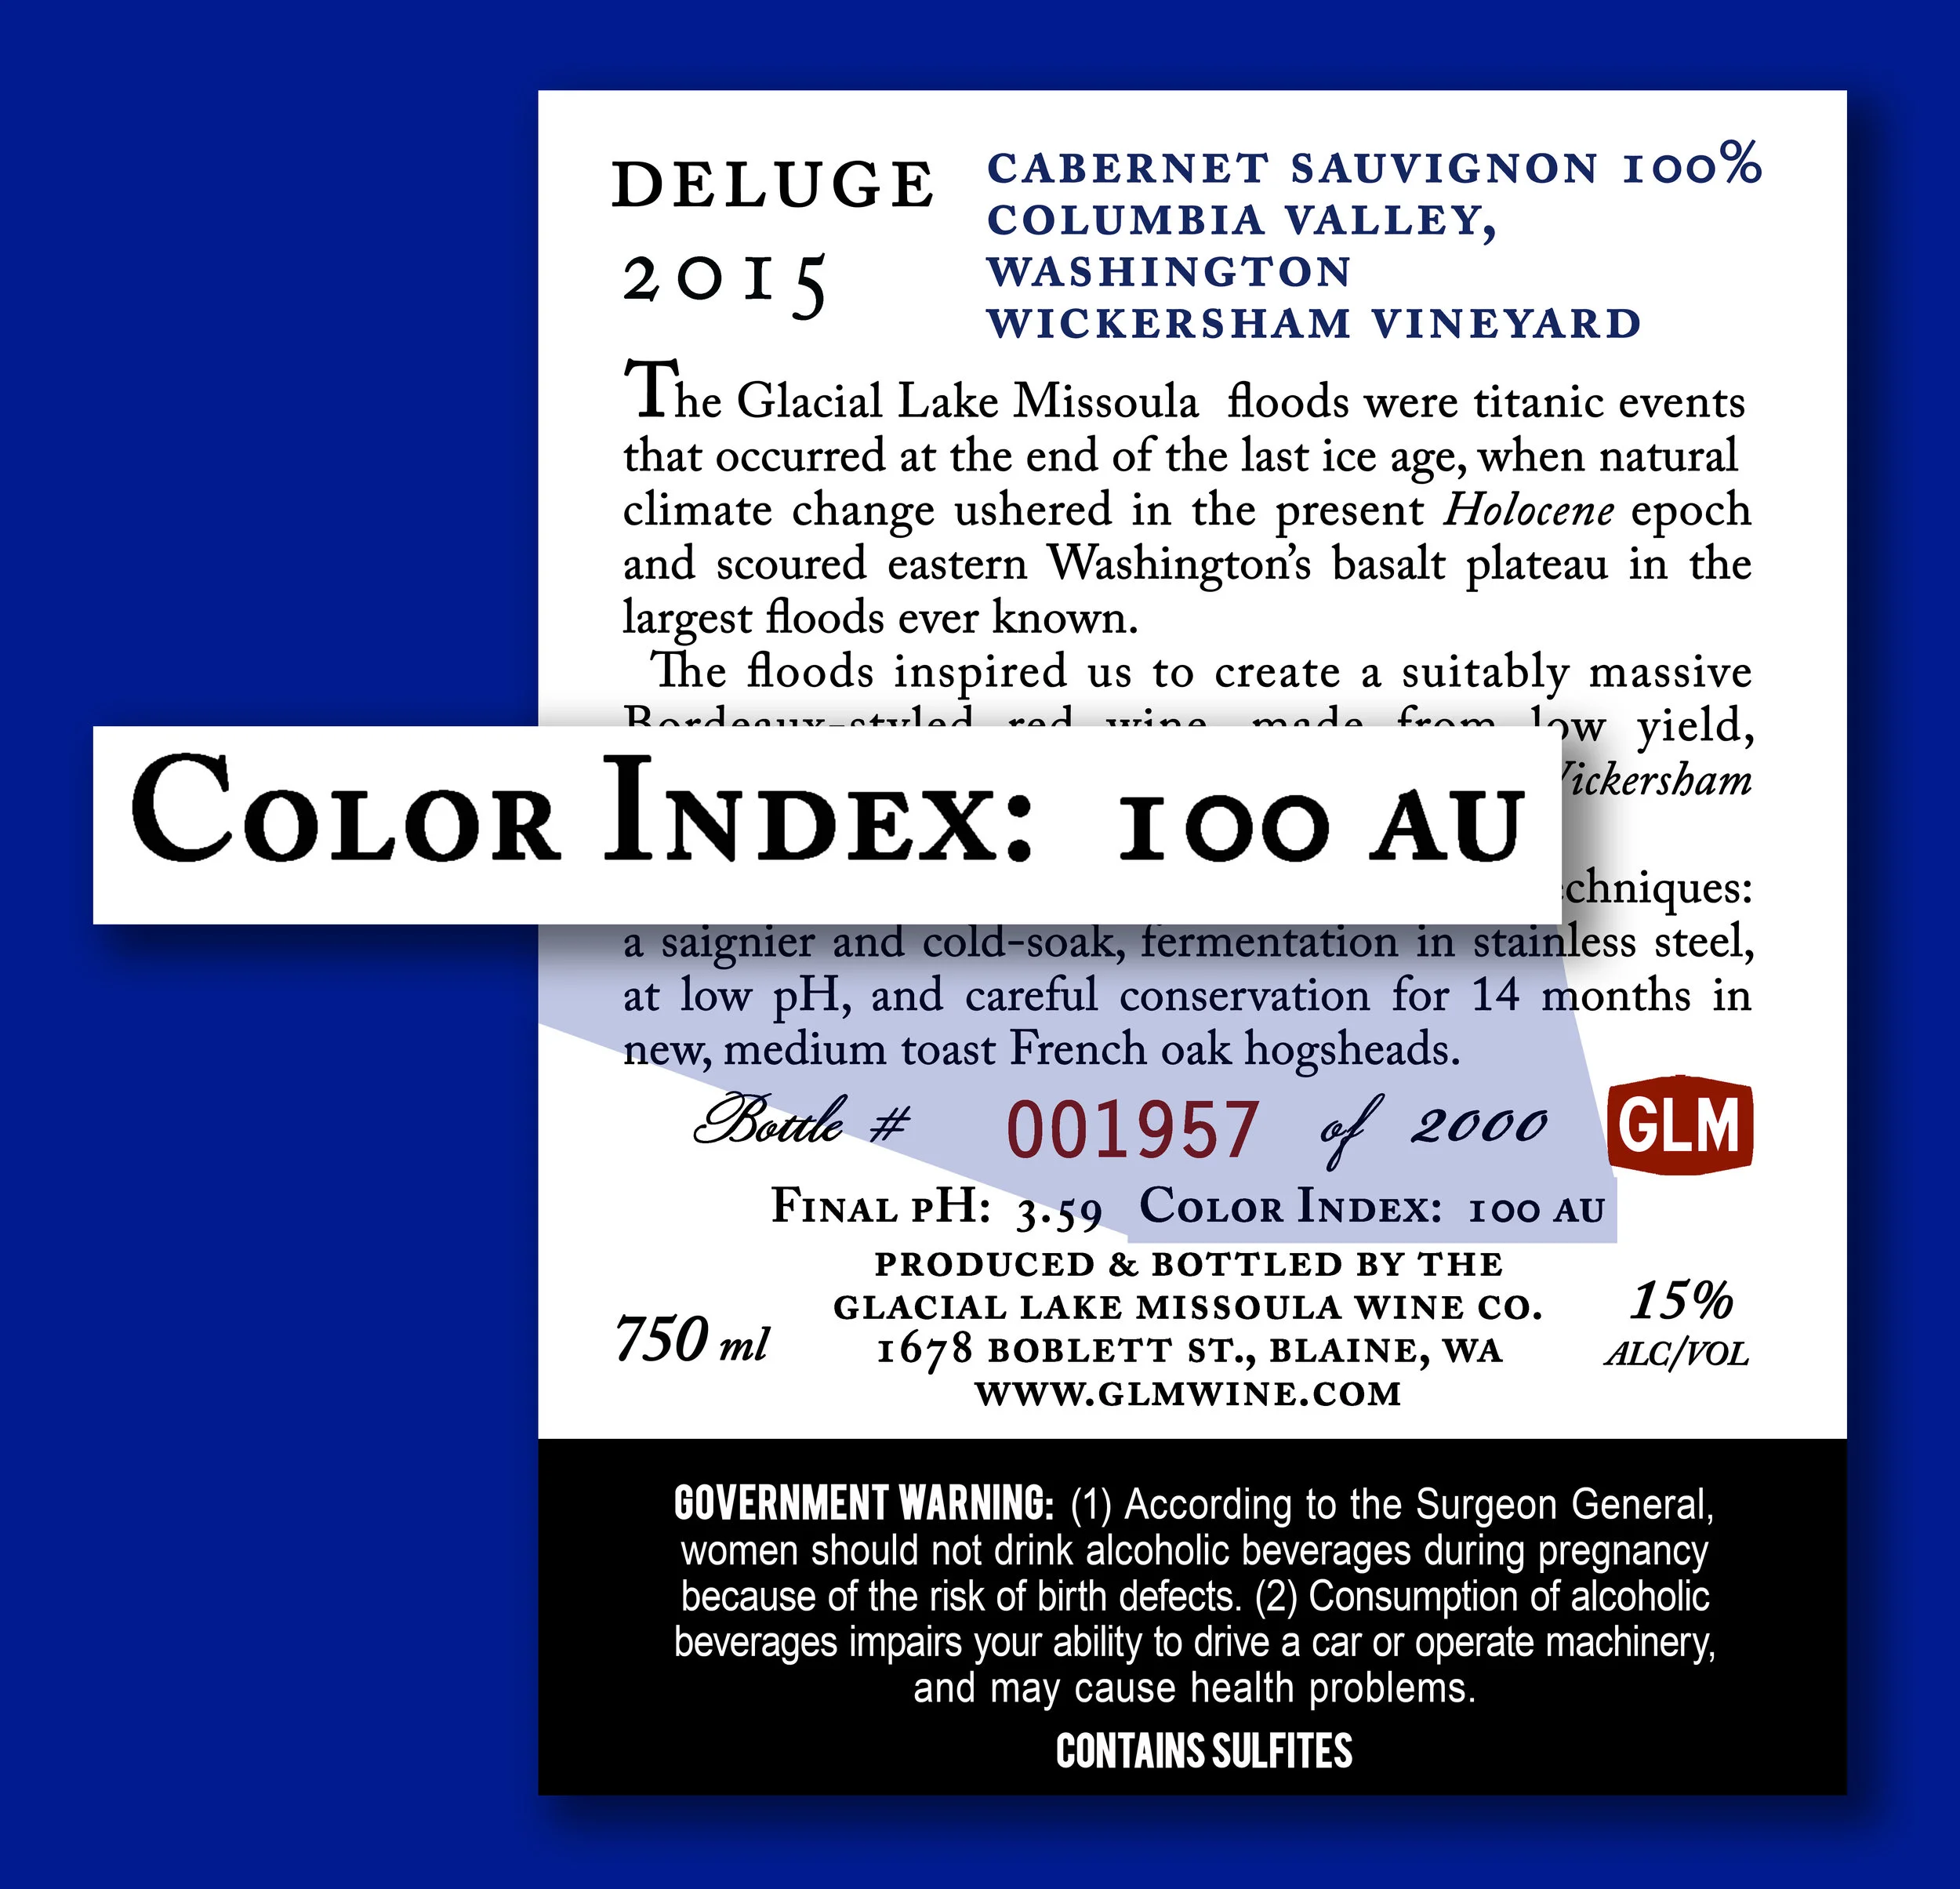
Our back label
Every red wine that we make, lists on the label, a measurement of the wine's total phenolics, called the Color Index. It tells the consumer how much phenolics are in the wine - and thus how deeply colored and astringent it should be. If this were on all red wine labels, there would be a lot less disappointed consumers. Everyone has cracked an expensive bottle of Oregon Pinot Noir - or some other much heralded wine, from a heavy dark-glass bottle, expecting a dark, velvety beverage, only to find a pallid pink liquid usher forth.
The Color Index is a way to know how concentrated a particular bottle of red wine is, instead of just relying on generalizations about a vintage, or the reputation of a maker.
The Color Index is measured by shining a beam of ultraviolet light at the frequency of 280 nanometers, through a diluted sample of red wine. After accounting for the factor of dilution, a number of absorbance units (AU) is arrived at.
You can see the spike at 280nm that all red wines share. The higher the spike the more phenolics, and the more exceptional the wine.
The Wine Spectrum, Chris Somers, 1998
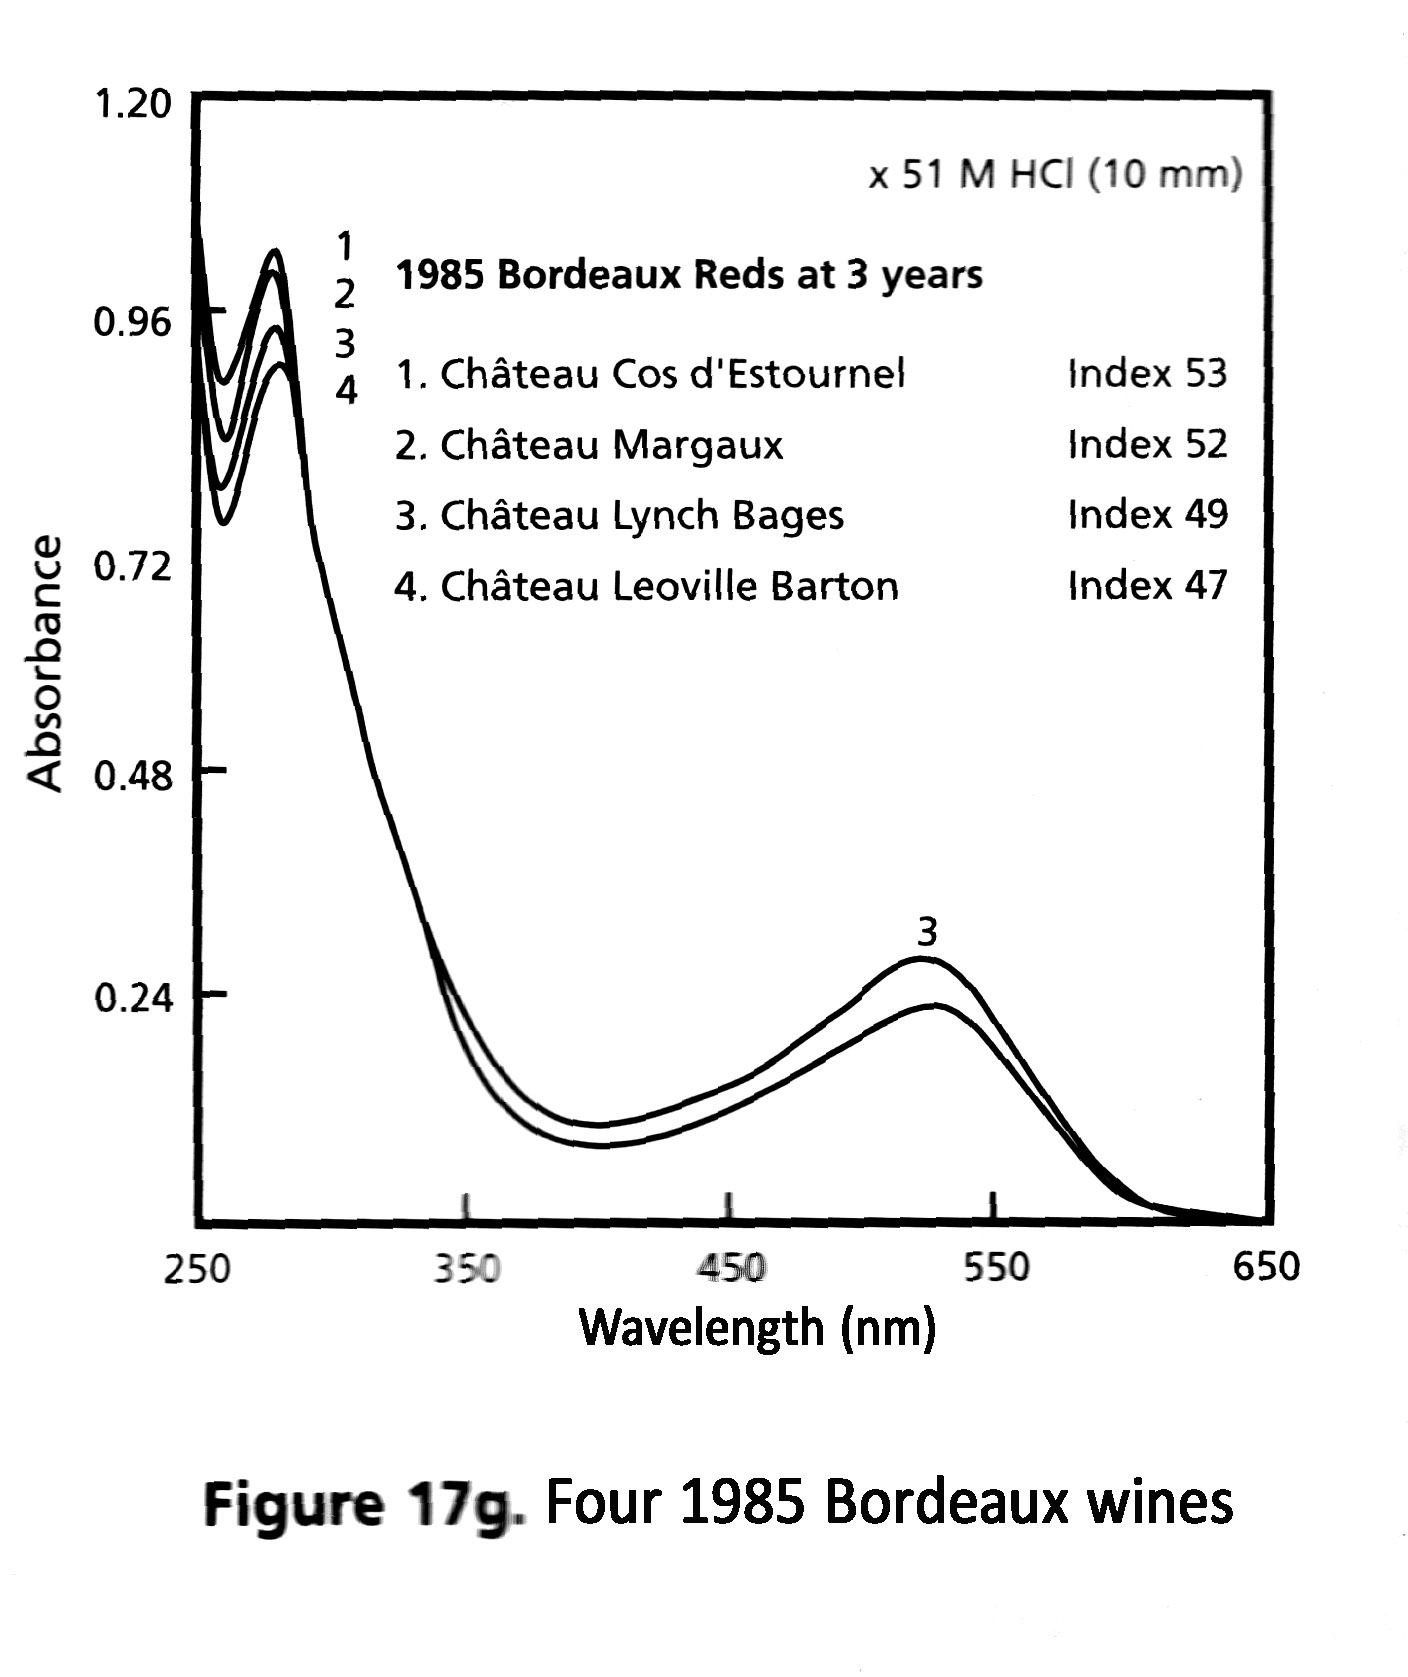
The Wine Spectrum, Chris Somers, 1998
Australian wine scientist Chris Somers gives following guideline:
Ordinary Wines - 20 - 30 AU
Medium Quality Wines - 30 - 40 AU
Superior Wines - 40 - 80+ AU
A good benchmark for the color index is to think of great Bordeaux red, of a good vintage, as being in the 50 AU's.
Their are other ways to measure total phenolics (one is the spike at 520nm) or the more common chemical tests.
What Chris Somers believes is that the magic of the 280nm measurement is that it quantifies a specific class of phenolics in the grape - the secondary metabolites.
We also list the final pH of our wines on the label. These two parameters, the Color Index, and pH are essential to evaluate objectively a red wine's quality. The main reason that a wine's pH should be optimal from primary fermentation through bottling, is that acidity inhibits spoilage organisms. It amazes me that unlike reviewers of cars, or electronics, wine critics take no measurements, and yet make pronouncements about a wine's quality or longevity. You can't taste pH.
(pH is the measurement of available Hydrogen ions in a solution. Pure water has a pH of 7.0 - the lower the number, the more acidic.)
A pH above 3.8 is into a red wine's danger zone - it will begin to fade and should be drunk in just a few years. A wine with a pH above 4.0 will crash and burn in the cellar - yet many ultra-premium red wines, from Washington or California have pH's well above 4.0!
Low pH wines taste very approachable when young, but it is an illusion - the wine will age at an accelerated rate, and any wine faults (sulfur compounds typically) will stand in the foreground. A high pH when will also require much higher levels of free SO2, further accentuating sulfur aromas.
The ideal final pH for a red wine is in the 3.5 - 3.7 range. Wines in this range will age well in the cellar, retain fruitiness and have a brilliant red color. pH also affects the hue of wines - high pH wines lean to the purple side of the spectrum, and the colors become dull and blackened with time.
The Color Index and Solar Activity
This is a proxy measurement of solar activity by its interaction with the Earth's magnetic field
This is the same graph with all of our wine's color indices. The points are placed at veraison in the growing season.
Does solar UV light, which is elevated in the Sun's output when solar activity is high, have an impact on red wine quality?
From my limited experience I believe it does. The only wine I have made as an amateur that I measured the Color Index on was my 2000 Cab, and all subsequent GLM wines. It sure looks like it to me, so far. The latest wine that we've made is our 2015 Cabernet, made from grapes sourced from Wickersham Vineyard, near the City of Yakima. The color index is through the roof - 104.7 AU! The highest color index of one of our wines previously was 76 for our 2003. 2003 was like 2015 - situated at the second peak (each cycle has two peaks) of the solar cycle.
Sunspots from 2000 - 2015

This is another measure of solar activity, by measuring the cosmic rays (neutrons and protons travelling at near the speed of light) from detectors buried deep in the earth. The graph is almost the inverse of the sunspot graph in that the low spots being intense solar activity (that deflects cosmic rays from earth) and the high parts are proof of low solar activity - that allows more cosmic rays to strike the earth.
Interestingly, I made two outstanding Cabernets from Cave Junction, OR fruit in 1991 and 1992. This is the lowest point on the 54 year graph, thus the highest level of solar activity in that time-frame.
The next outstanding Cabernets that I made were in 2000, 2002, 2003, 2004, and 2005 in a stretch of high solar activity. With the exception of a good Pinot Noir from Cave Junction, OR fruit in 1996, all of the wines I made from 1993 - 1999 were with sound, but uninspiring grapes. Our latest wines from 2013, 2015, and 2016 were all good, and 2015 the best we’ve ever sourced.
The cosmic ray modulation is amplified by effecting cloud formation, and thus radically altering the earths energy budget. Clouds reflect back much of the incoming solar energy. A less active sun allows more cosmic rays, which means more clouds, which lessen the amount of energy received from the sun. Conversely, a more active sun reduces cosmic rays, thus reducing cloud formation, and allowing more solar energy to enter the atmosphere and (most importantly) the oceans.
The glorious, cloudless, late summers in Cave Junction in ‘91 - ‘92, which created wonderful, intensely colored and intensely fruity grapes, was no coincidence. Also, the long double El Nino, that positively impacts the coastal Northwest, was possibly connected to the same solar activity.
If only everyone published the color indices of their wines, it would be easy to prove a correlation.
Any WSU enology students: this is real potential for a paper!
Note: Total phenolics of red wine-grapes can vary up to 5 times - with grapes that look to the naked eye - the same. UV levels and all the other environmental factors all play a part.
Here are the Color Indices of our wines:
Cabernet 2000 - 65AU, Yakima Valley, WA
(2001 no wine made)
Deluge 2002 55 AU, Yakima Valley, WA
Deluge 2003 76 AU, Yakima Valley, WA
Deluge 2004 66 AU, Yakima Valley, WA
Deluge 2005 - 60.6 AU, Yakima Valley, WA
Deluge 2006 52 AU, Yakima Valley, WA
Deluge 2007 52 AU, Yakima Valley, WA
Deluge 2008 58 AU, Yakima Valley, WA
Cabernet Sauvignon 2009 45 AU, Yakima Valley, WA
(2010 no wine made)
Gamay Noir 2011 45 AU, Umpqua Valley, OR
(2012 no wine made)
Merlot 2013 45 AU, Columbia Valley, WA
(2014 no wine made)
Cabernet Sauvignon 2015 104 AU, Columbia Valley, WA